Unplanned downtime
Events are missed when alerts sit in separate systems or arrive after a shift has ended.
Response starts sooner.
Operations efficiency dashboards for UK industry
Zealander Fusion Ltd builds operations dashboards for manufacturing, logistics, and fleet-heavy businesses. See downtime, route performance, throughput, and resource use while there is still time to act.
Built for plant managers, transport leads, and operations directors.
The operational cost of delay
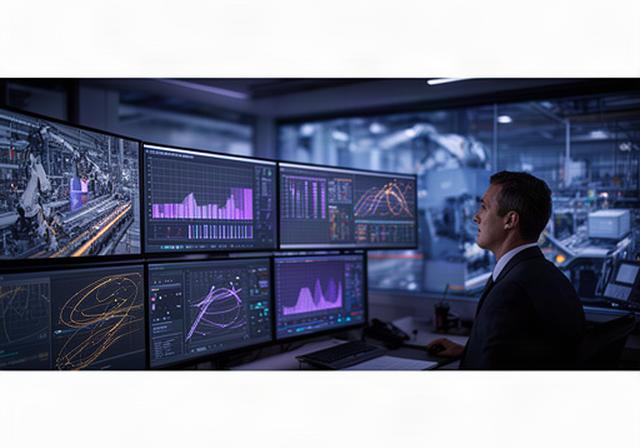
Every hour of unplanned downtime or every inefficient route affects output, labour, and customer commitments. The signal is often present in machine logs, telematics, and spreadsheets. We put it in one working view.
Events are missed when alerts sit in separate systems or arrive after a shift has ended.
Response starts sooner.
Late departures, empty miles, and slow stops increase fuel and labour costs across the week.
Variance becomes visible.
Throughput can look healthy at plant level while one line or shift quietly limits output.
Capacity gets clearer.
Fragmented scheduling views hide idle vehicles, maintenance needs, and uneven driver workloads.
Assets work harder.
One operational view
The right KPI depends on the decision in front of you. Zealander Fusion Ltd connects plant, fleet, and scheduling data so managers can move from a headline number to the asset or shift behind it.
Compare output, cycle time, and efficiency by machine, product line, and shift.
Set alert thresholds, tag root causes, and review the minutes lost to recurring events.
See vehicle utilisation, idle time, maintenance schedules, and driver performance.
Compare planned and actual journeys, delivery performance, fuel use, and cost variance.
Built for action
Clear screens. Useful alerts. Drill-downs that answer the next question.
Receive alerts for downtime events, threshold breaches, and maintenance due dates before they become a shift report.
Example: notify at 12 minutes stopped
Compare planned and actual time, distance, fuel, and delivery performance across depots and routes.
Example: cost variance by depot
Use throughput trends to see where demand may exceed available hours, people, or machine capacity.
Example: next-shift capacity view
Move from a group result to one vehicle, machine, driver, route, or recurring fault without rebuilding a report.
Example: fault history by asset
Give supervisors a consistent view of output, stoppages, attendance, and handover actions.
Example: shift comparison board
Turn repeated downtime into a usable pattern by recording cause, duration, owner, and corrective action.
Example: recurring fault analysis
Measured operational improvement
The dashboard gives managers a common set of facts for the morning meeting, the shift handover, and the weekly improvement review.
Better information changes the next decision.
potential downtime reduction through real-time monitoring and faster response
for site, shift, machine, route, and vehicle performance
with fleet utilisation and maintenance needs visible together
when bottlenecks are tied to capacity and throughput trends
A practical route to rollout
We start with the decisions your team needs to make. Then we connect the data behind them.
We review machine, fleet, scheduling, and finance data.
We agree how throughput, downtime, and route success are measured.
We create live monitoring, alerts, comparisons, and drill-downs.
Managers and supervisors learn the screens during real operating routines.
Anomaly detection and feedback shape the next useful improvement.
Make the next shift clearer
Bring a production, delivery, or fleet reporting problem to Zealander Fusion Ltd. We will map the useful data, show the right operational view, and set out a sensible next step.
A focused discussion. Practical recommendations.